 Covering COVID-19 is a daily Poynter briefing of story ideas about the coronavirus and other timely topics for journalists, written by senior faculty Al Tompkins. Sign up here to have it delivered to your inbox every weekday morning.
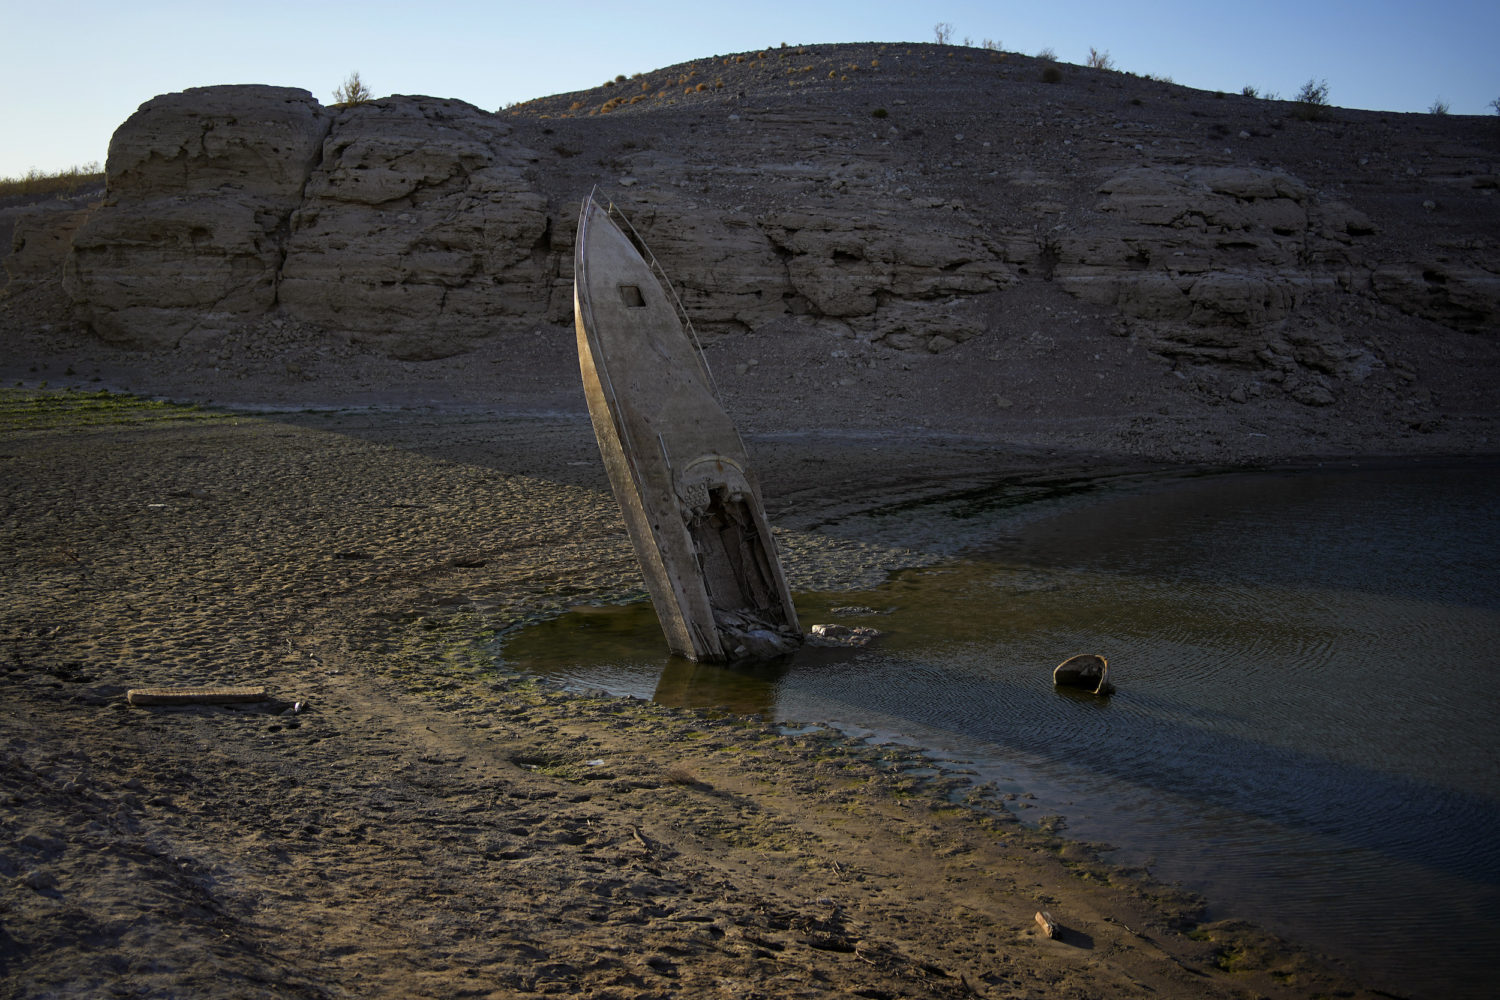
Let’s start with the concerning news: the size of America’s severe water shortage. But read on about why there is a beam of hope.
The darkest color on the U.S. Drought Monitor map below is classified as “exceptional drought,” while the dark red is “extreme drought.” Some of the yellow areas, which are lighter drought conditions, are new to the map. In other words, they are just starting to dry out as summer heat sets in.

(U.S. Drought Monitor)
This week, there are some reasons to hope that while there are large areas of severe drought, there is some easing, too. Here are a few such examples, from the U.S. Drought Monitor:
- The Upper Midwest remained cooler than normal and generally wetter than normal, leading to some improvements in abnormally dry areas.
- Much of the High Plains Region has seen beneficial rainfall and temperatures averaging near to below-normal over the past 30 days. However, above-normal temperatures finally crept in this week, as temperatures ran more than 3°F above-normal for much of the region. Despite the above-normal temperatures, precipitation was also above-average for many locations, warranting broad 1-category improvements in the drought depiction where more than 1 inch 7-day surpluses were observed and where longer-term deficits were appreciably diminished.
- Much of the Northern Tier of the U.S. from the Pacific Northwest to the Northern Plains, has seen marked improvements in recent months due to a persistent storm track and near to below-normal temperatures. That same pattern continued this week and continued to eat away at long-term precipitation deficits and indicators, such as groundwater. Additionally, some high-elevation locations have even picked up additional snowpack and stream flows are running near to much above-normal over the past 28 days. Given the wet conditions in recent months and the continuation of the active storm track, broad improvements are warranted again this week.
- Much of the Northern Tier of the U.S. from the Pacific Northwest to the Northern Plains, has seen marked improvements in recents months due to a persistent storm track and near to below-normal temperatures. That same pattern continued this week and continued to eat away at long-term precipitation deficits and indicators, such as groundwater. Additionally, some high-elevation locations have even picked up additional snowpack and stream flows are running near to much above-normal over the past 28 days. Given the wet conditions in recent months and the continuation of the active storm track, broad improvements are warranted again this week.
A few areas got drier in the last week and moved into what the Drought Monitor called D(0) conditions, which you see in yellow on the map.
- Parts of the Corn Belt and Ohio Valley have started to dry out, as precipitation has been hit-or-miss in recent months, pushing short-term deficits to increase further (60-day rainfall deficits of more than 3 inches in many locations). As such, targeted expansion of D0 was warranted in parts of Kentucky, Indiana, Illinois, and Missouri.
- Areas in southwestern Colorado and just east of the Front Range in Wyoming experienced some degradation, as temperature anomalies were highest in those areas (6°F to 9°F above-normal). Also, high winds have helped to exacerbate ongoing drought in those locations.
- Elsewhere in the Western Region, despite the much above-normal temperatures, a general status quo depiction was warranted, the exception being Nevada and New Mexico. A slight expansion of extreme drought (D3) was warranted in central Nevada, where 7 to 28-day average stream flows are running below the 5th percentile of the historical distribution, vegetation indices are indicating similar signals as D3 areas to the east, andKBDIs are indicating high soil moisture deficiency in the upper layers. Despite some nearby monsoon precipitation in parts of New Mexico and Arizona, accumulations were not enough to change the severe (D2) to exceptional (D4) drought depictions in areas where the rains fell. Given the temperatures were running anywhere from 5°F to 10°F above-average, and coupled with windy conditions, additional degradations were made in parts of western and southern New Mexico.
When we speak of droughts, we often look right past Hawaii and Alaska, but both are experiencing drought conditions. The islands are reporting some browning vegetation and lower stream flows. This week’s data shows, “Much of southern Mainland Alaska was experiencing abnormally dry (D0) conditions, with a small region of south-central Alaska depicted in moderate drought (D1), leading up to this week due to above-normal springtime temperatures and below-normal precipitation.” Puerto Rico also is drier than normal with some drought areas on the map.
The Drought Monitor offers a collection of more than 20 years of drought maps in animated loops.
There is one other punch in the gut from National Geographic:
A new study in Nature Climate Change shows that Earth’s warming climate has made the western drought about 40 percent more severe, making it the region’s driest stretch since A.D. 800. And there’s a very strong chance the drought will continue through 2030.
“Not only is this drought continuing to chug along, it’s proceeding at as full-steam pace as it ever has been,” says Park Williams, a climate scientist at UCLA and an author of the new research.
2022 offers a ‘wildfire year,’ not a ‘wildfire season’
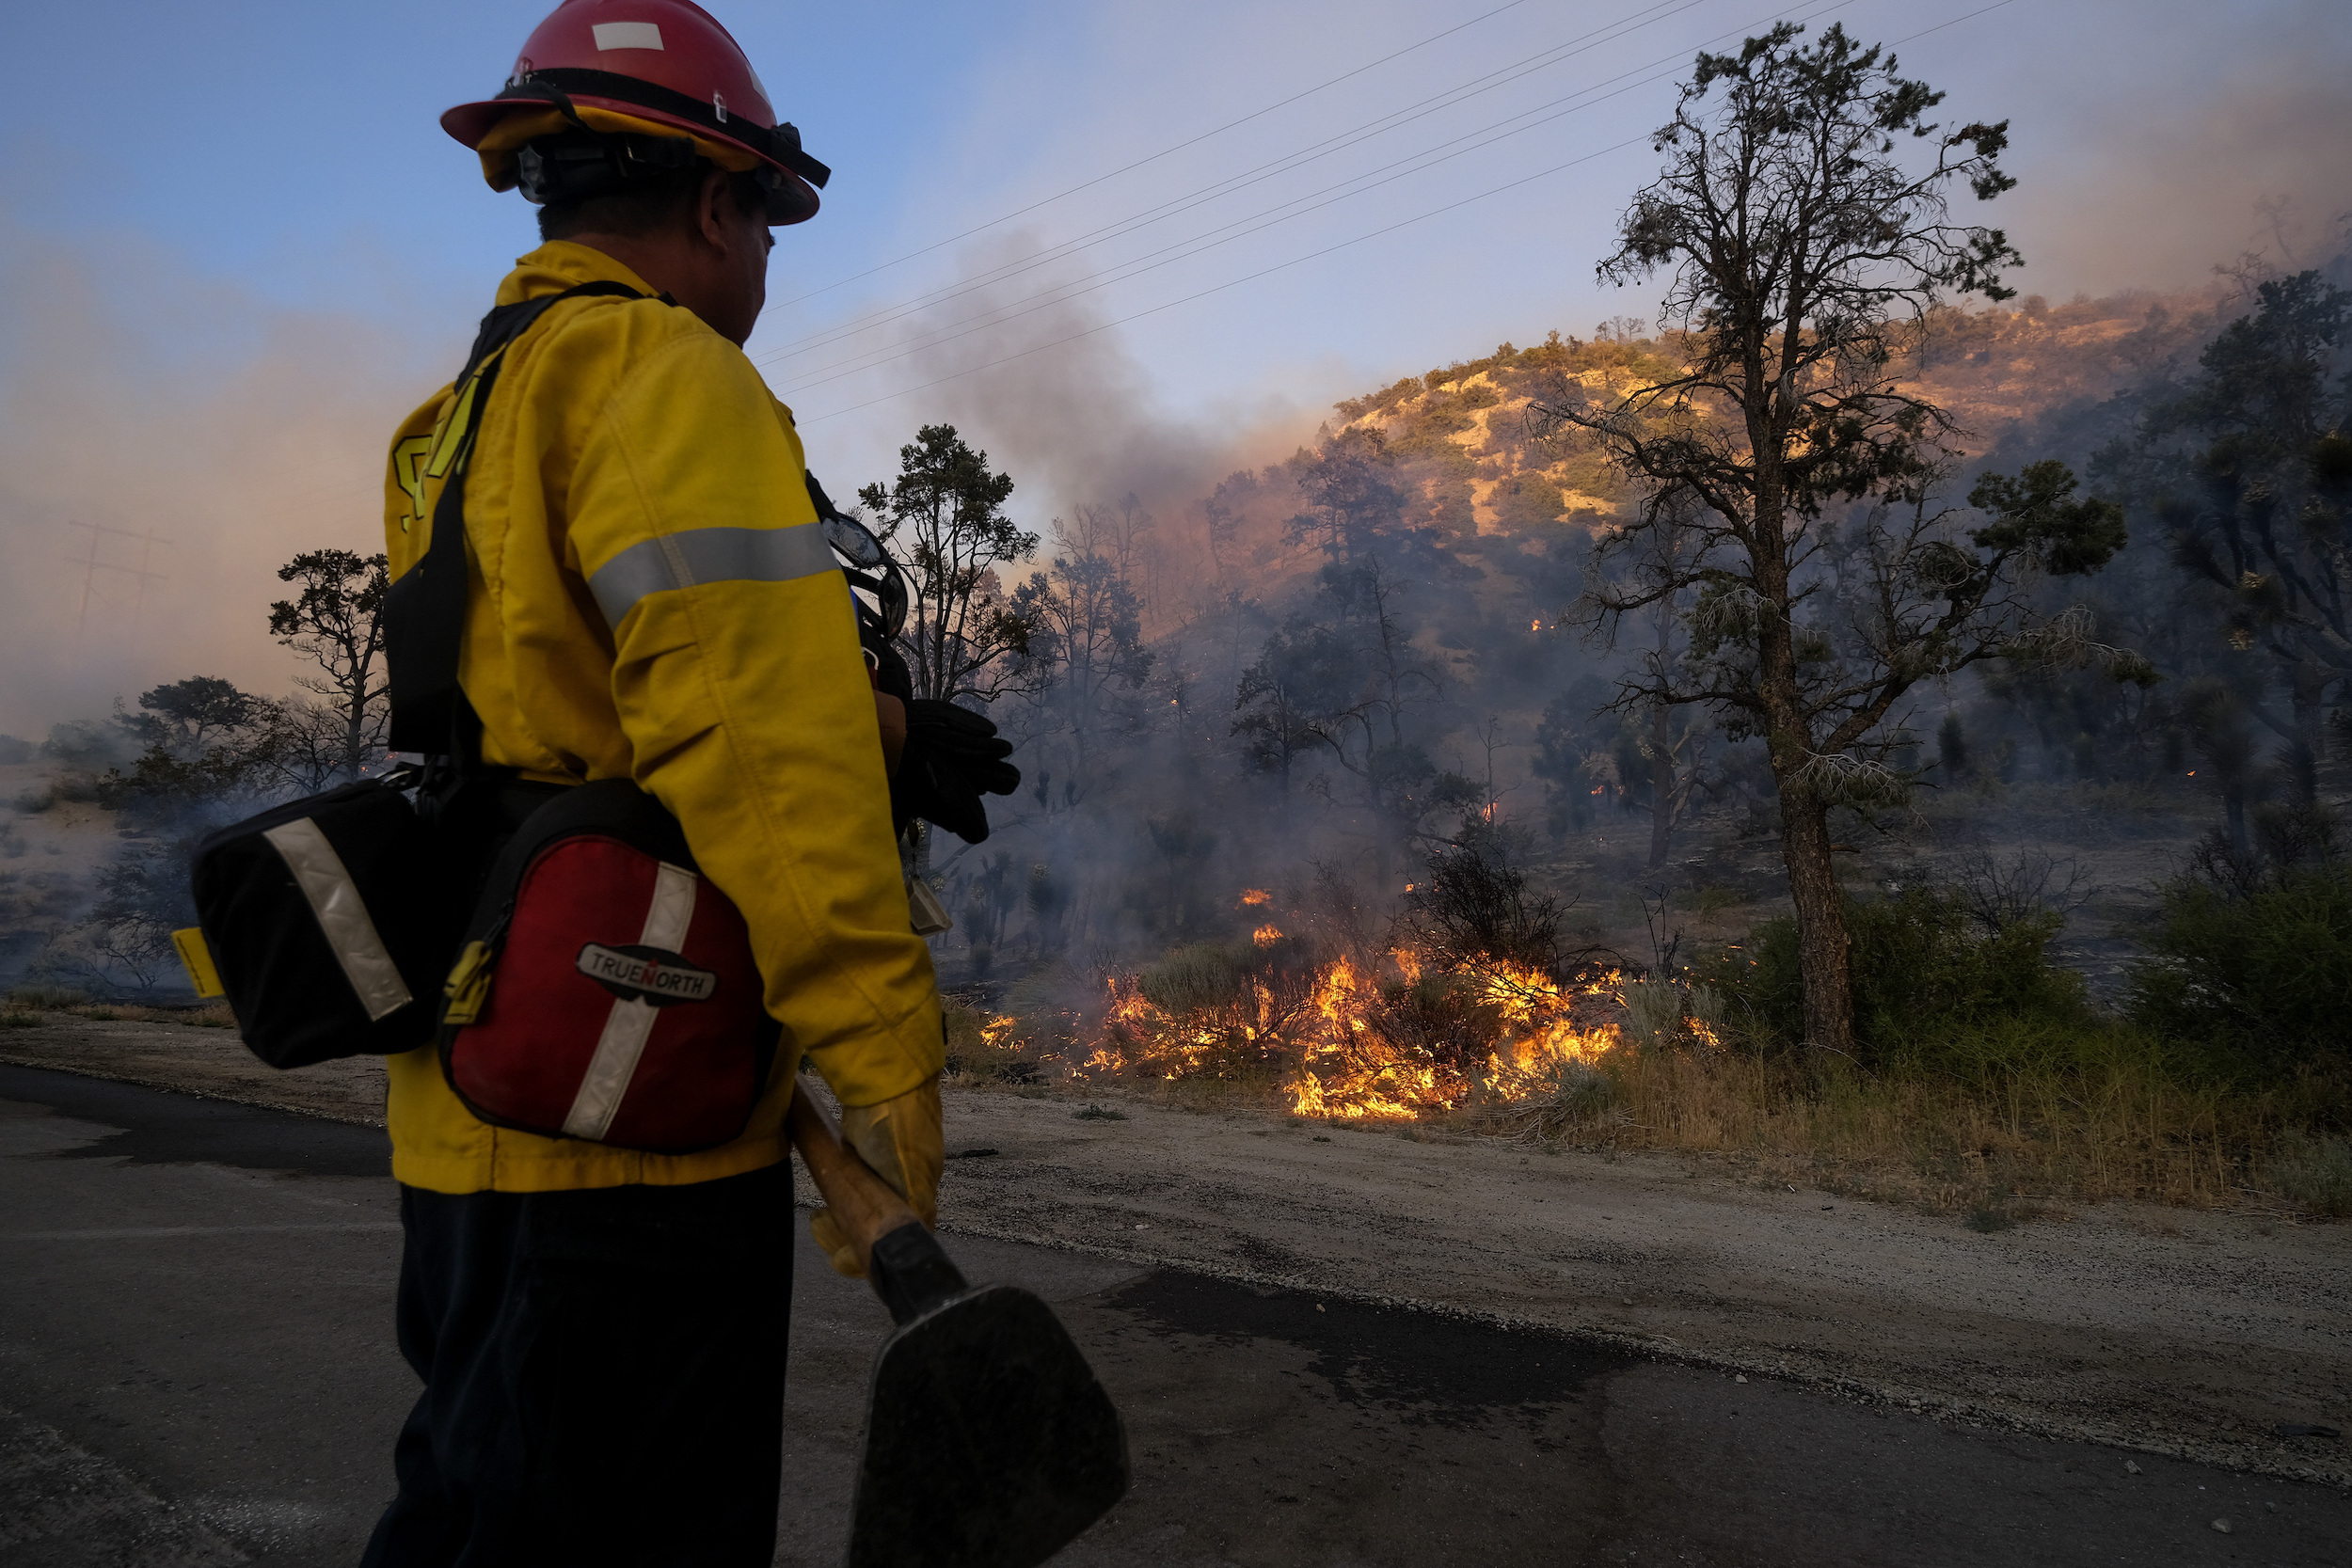
A firefighter watches as the Sheep Fire burns in Wrightwood, Calif., Sunday, June 12, 2022. (AP Photo/Ringo H.W. Chiu)
We begin summer with wildfires, especially in the American West, well ahead of normal rates. Fires have consumed more than 3 million acres already and today starts what used to be the fire season. 96% of the fires so far were caused by humans.

(The New York Times)
Here are active fires on this day, the first day of summer.

(U.S. Incident Information System)
You can also now see active wildfires on Google Earth. Mashable explains:
If you click the layers icon in the app, which looks like a diamond on top of another diamond, you’ll notice a new fiery icon next to the “transit,” traffic,” and even “COVID-19” layers. It’s clearly labeled “Wildfires.” That pulls up all active fires, no matter how zoomed in or out you are on the map.
Google also explains its SOS Alerts app:
If you’re near a major crisis and you search for related words or phrases on Google, you may see a banner indicating that there’s an ongoing crisis, followed by emergency information and resources such as useful translations or phone numbers. If you’ve installed the latest version of the Google app (Android and iOS) and your location is turned on, you may also receive a notification on your mobile device’s home screen. Tap the notification to see the full alert on Google Search.
A summer of Lyme disease, cases growing
A new study of studies (called a meta-analysis) shows about 14% of the world’s population likely has had Lyme disease. That number includes about one in five Europeans and more than one in 10 East Asians.
The Association of Health Care Journalists is trying to help journalists cover Lyme disease this summer. AHCJ reports:
“There are more tick-borne disease cases every year,” said John Aucott, M.D., director of the Johns Hopkins Lyme Disease Clinical Research Center, during a June 8 AHCJ webcast. “This is an insidious epidemic. It hasn’t been as dramatic as COVID-19, so it has crept up on us.”
Ticks are emerging earlier from winter hibernation and staying active longer because of climate and deforestation, according to public health experts. As a result, Americans’ risk of infection from pathogens carried by the outdoor pests is rising. According to the CDC, the total number of tick-borne diseases reported to the agency rose by 125% to 50,865 in 2019 from 22,527 in 2004.

(CDC)
Starting today, five planets align
Starting today and through the end of the month, Mercury, Venus, Mars, Jupiter and Saturn will be lined up and visible above the eastern horizon every early morning. It is the first time in 18 years that they have lined up this way and it won’t happen again until 2040. Accuweather explains:
The parade of planets will be best seen about 45-60 minutes before sunrise on cloud-free mornings through the end of the month. Since June features some of the earliest sunrises of the entire year, this translates to heading outside before 5 a.m., local time, to look skyward.
Mercury is the most elusive of the planets that can be seen with the naked eye due to its close proximity to the sun. The tiny planet will remain very low on the horizon, so seeing it requires an unimpeded view of the eastern horizon as trees, buildings and mountains all could potentially get in the way.
Venus will be a guide to spotting Mercury, glowing brighter and appearing just above and to the right of the closest planet to the sun. Mars, Jupiter and Saturn will be much easier to find as they will be higher in the sky.
EarthSky.org is collecting photos of the display. This is not like a blazing sunset or a dramatic eclipse. You have to be a little space nerdy to see the wonder in this.
We’ll be back tomorrow with a new edition of Covering COVID-19. Are you subscribed? Sign up here to get it delivered right to your inbox.