
Not long ago, reporters on the immigration beat had a go-to data source: TRAC. The Transactional Records Access Clearinghouse, based at Syracuse University, made federal immigration data accessible, searchable and reliable. If you needed to know the number of Ecuadorans who had passed through the immigration court closest to you, you could find it.
TRAC is still the workhorse it’s always been, but today, it’s got a fair bit of company.
In my Beat Academy role, I collect tools to help reporters localize national stories, and I noticed some new immigration information sites that have emerged since President Donald Trump took office.
The cause — nationwide immigration enforcement — is obvious, and by and large, the sites I’ll mention can be trusted in the ways they use government data.
But they also raise important concerns about transparency, and journalists who want a quick way to see what’s going on in their backyard should take note.
A man who has fueled this proliferation of web tools both celebrates and fears the trend.
“We’ve never had better immigration data, we’ve never had more creatively sourced immigration data, in the history of the country,” said Austin Kocher, a veteran of TRAC who focuses on closing the gap between data and journalists.
“The other thing that’s also true is we are living in a Wild West,” Kocher added. “There are a lot of people getting their hands in datasets that they never have before.”
In addition to being a research assistant professor at Syracuse, Kocher is president of the private firm Relevant Research, home to the Immigration Enforcement Dashboard and ICE Detention Reports. The first shows recent numbers of arrests, detainers and removals, aka deportations, with detention stats through October 2025. The other shows the number of people at detention centers across the country.
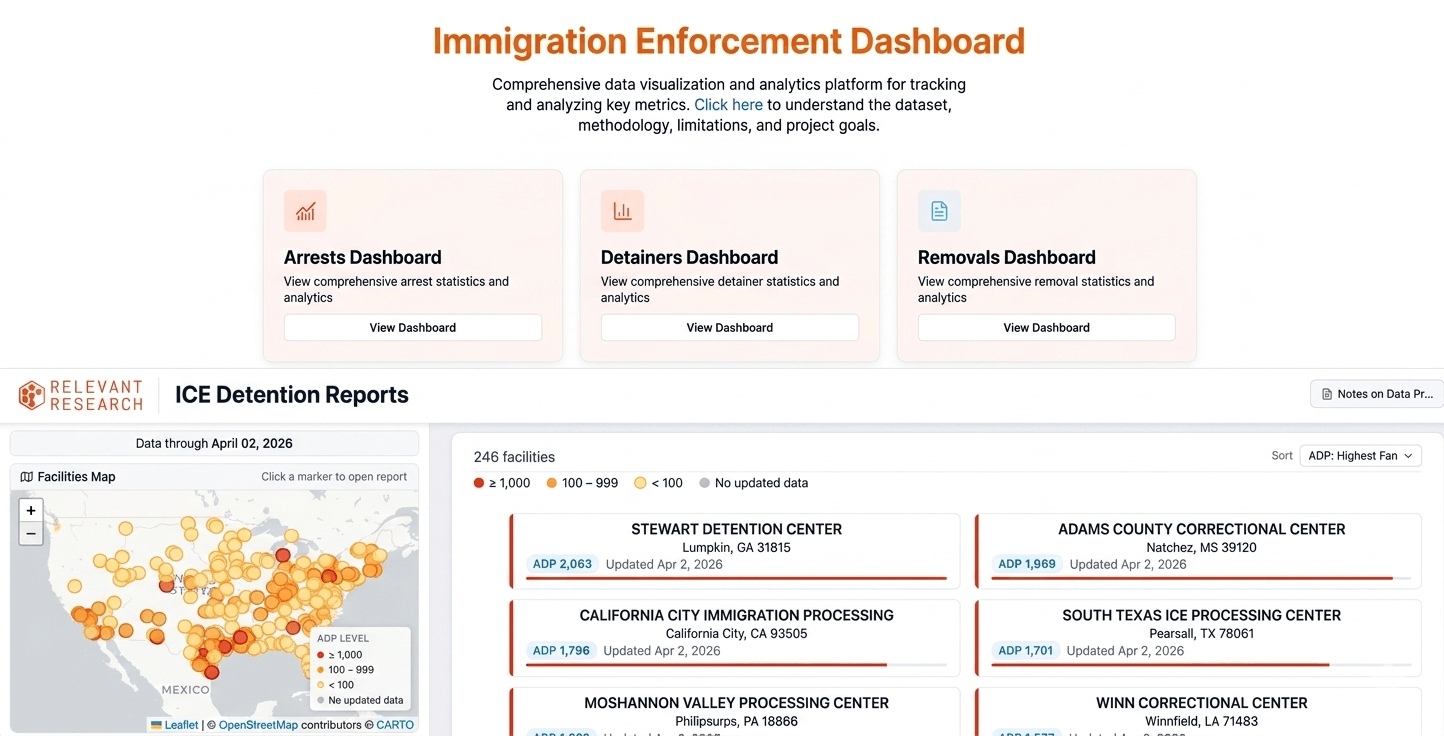
The websites Immigration Enforcement Dashboard and ICE Detention Reports speed the process of seeing immigration enforcement action at the state or local level. Both draw on government data and both are projects of Relevant Research. (Screenshots)
What’s notable is that Kocher understands the importance of transparency and yet, of the two sites at Relevant Research, one does a much better job than the other.
The Immigration Enforcement Dashboard does a good job, with a prominent link to a full description of its data sources and methods. From there, you can follow a link to Relevant Research and see who is behind the work.
But someone who lands on Detention Reports through a web search would have to stumble around a bit. There’s a Notes on Data Processing page that spells out the government data source, and it’s nerdy enough to build trust. But while the homepage has the Relevant Research logo, it isn’t linked to the company website.
Even on the Relevant Research page, the cautious journalist would want to know more about the money behind it. When asked, Kocher gave a list of clients (Asians for Advancing Justice, Women’s Refugee Commission, America Families United, Unidos US, World Relief, Win Without War, Project on Government Oversight), but including that information on the site would build trust.
New policies fuel new data trackers
Part of the challenge for journalists is that, with almost mechanical predictability, Trump’s expansion of the enforcement machine has raised the profile of existing web tools and spurred the creation of brand new ones. Some are more transparent than others.
The Deportation Data Project has become the go-to site for data journalists, researchers and others who need to see the details and trends of arrests, detentions and removals. It offers a uniquely granular view, allowing users to follow individuals (anonymized) as they move through the immigration system.
Newsrooms from NBC News to The Seattle Times to New Hampshire Public Radio have cited it in their work. It also sits at the heart of Kocher’s enforcement dashboard and a separate detention-focused website from the advocacy group Vera.
The project sets a gold standard for transparency. The About page clearly names and provides the personal websites of the people behind the work: a political scientist at UCLA, a law professor at UC-Berkeley and a private FOIA lawyer. The Documentation tab offers a deep dive into their data sources and methods.
The framework of arrest, detention and removal is familiar ground. The big change is that Trump has put each of those steps on steroids. The data trackers have stepped up in response.
Flights, warehouses and local cops
FLIGHTS: Trump vowed to deport millions of people. That wasn’t going to happen by bus. As the enforcement machine ramped up, so did the flights carrying people across the globe.
Enter the ICE Flight Monitor.
This site tracks the charter and military planes that move ICE detainees from detention center to detention center within the U.S. and ultimately across the border. Now maintained by the advocacy group Human Rights Monitor, the project was the brainchild of a retired J.P. Morgan executive, Tom Cartwright. He started tracking ICE flights during Trump’s first term and as activity surged, so did demand for his work.
Among the nuggets in the latest report: Flights leaving the U.S. are up more than 65% from a year ago. Flights moving people within the U.S. are up nearly 150%.
The methodology section is reasonably complete. It notes reliance on open-source flight tracking platforms, but it would be nice if it named them, and it describes how airplane tail numbers are matched to ICE activities. Perhaps the strongest indicator that the work is on track is that ICE has taken steps to block those tail numbers from public sites like FlightAware.
The site is useful for localizing a national story. Bedford, Massachusetts, might not leap to mind as a significant transfer point, but with 124 flights last year, it’s in the same league as Dallas, which had 159. That was enough for the Bedford Citizen to report on largely unsuccessful state and local efforts to get answers from ICE about its use of the local airfield.
DETENTIONS: The number of people in ICE custody has reached historic highs, which means the government needs more places to hold them.
Plans to convert industrial warehouse space into detention facilities prompted a group of activists in Baltimore to launch the ICE Warehouse Purchase Tracker.
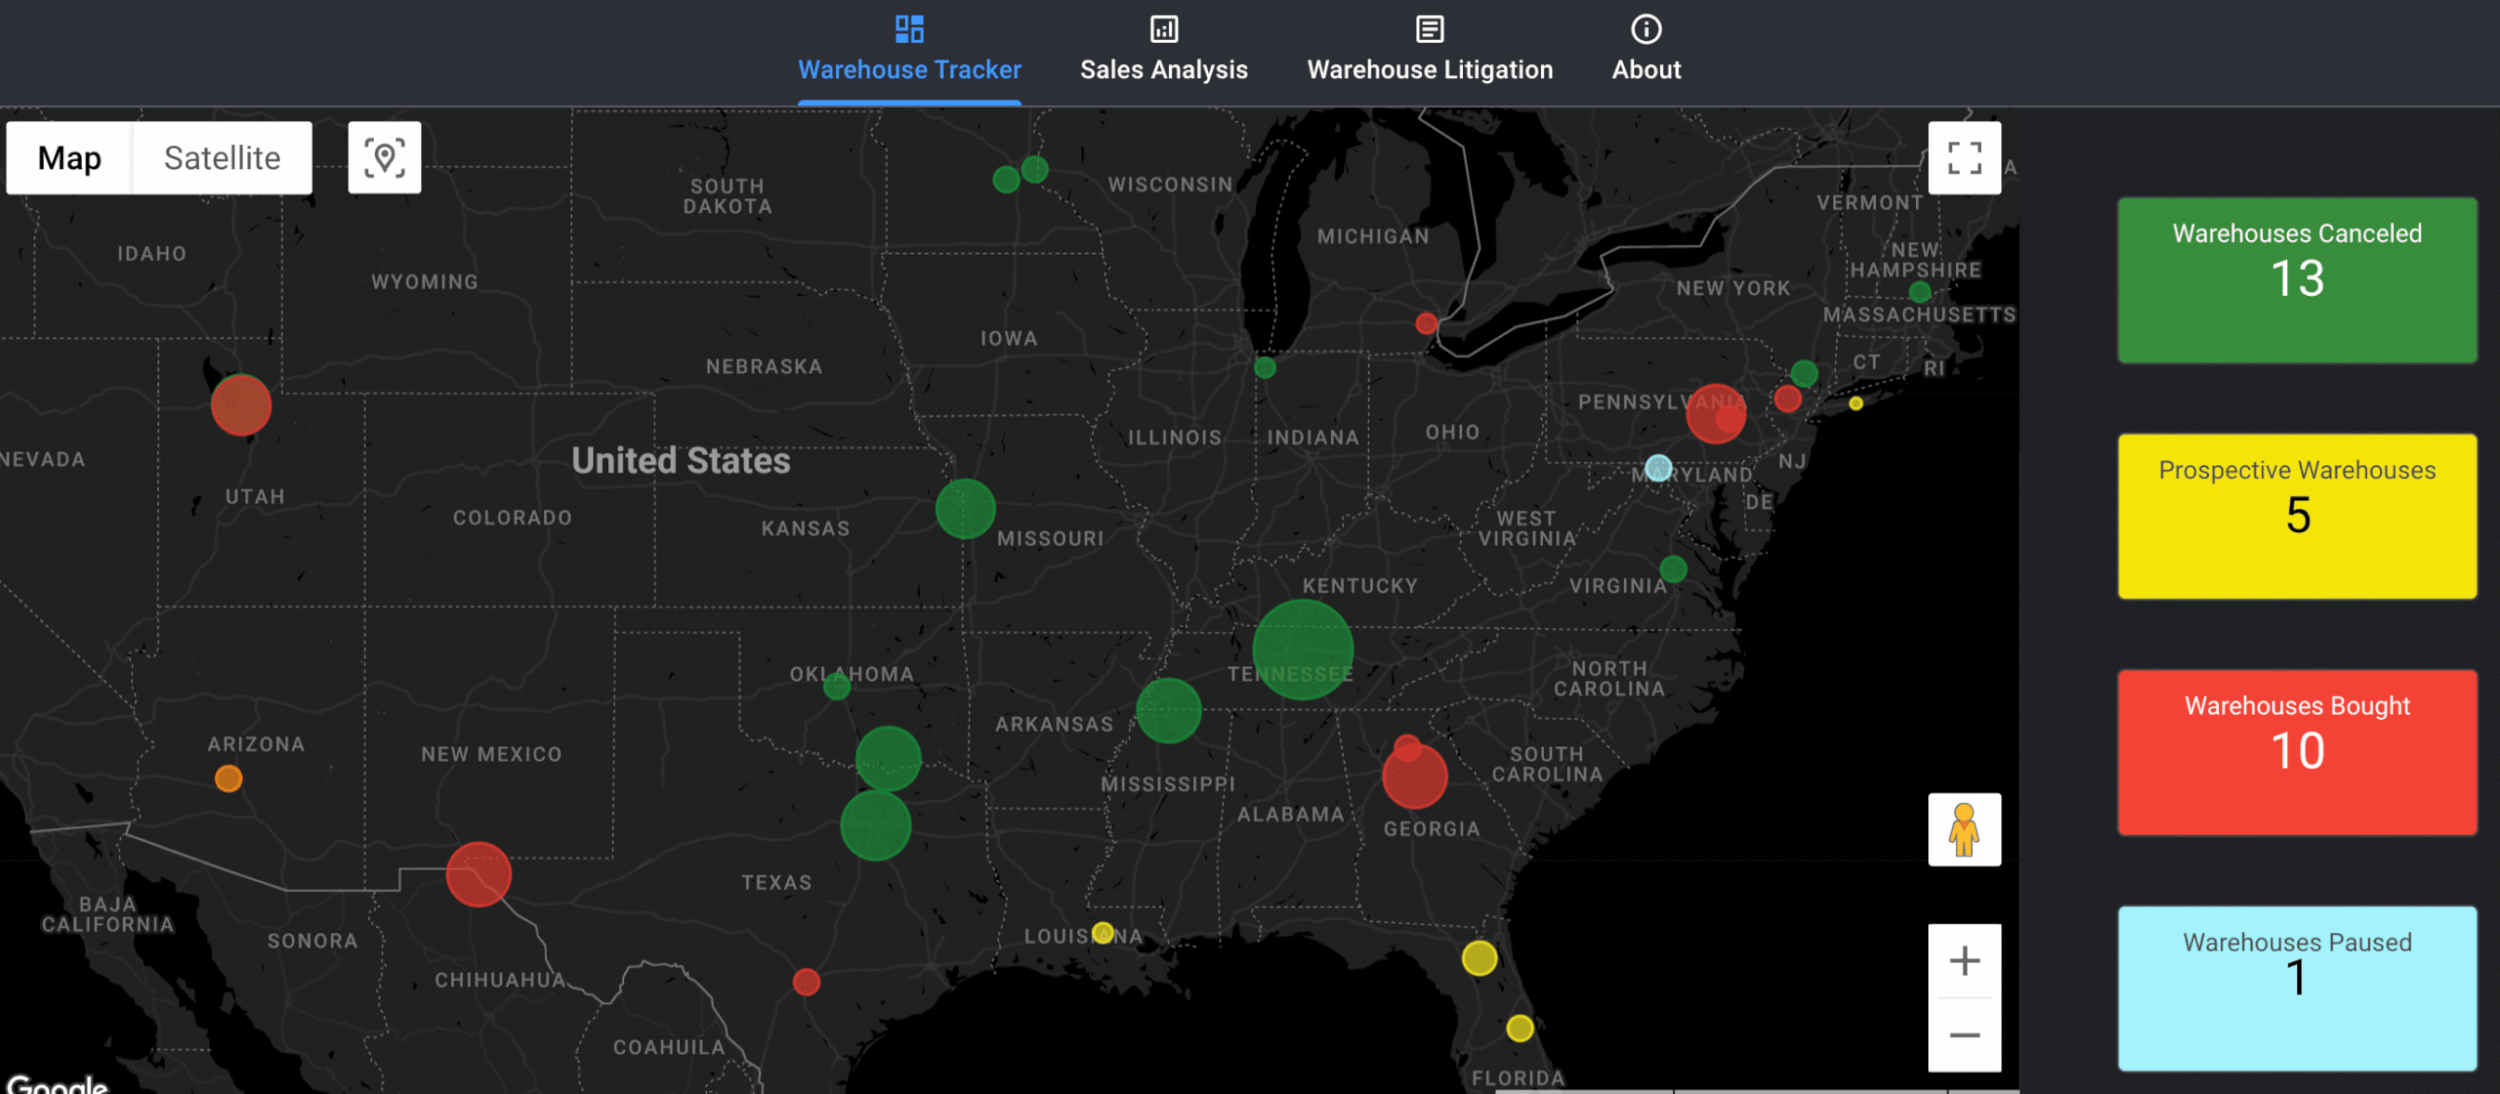
This map from the Baltimore-based group Project Salt Box can provide an early look at where ICE seeks to expand its detention capacity. (Screenshot)
The map helps local reporters quickly spot plans for a new detention center in their area. If a sale has already gone through, there’s room to cover the permitting process. If it’s pending, there’s grounds to bring the conversation forward.
The About page lists sources — from public land records to court transcripts — but it doesn’t spell out how they use this data. Most significant, it’s unclear how they spot properties in the first place.
One of the principals, Em Knepp, said the group monitors sites like LoopNet and GSA’s property inventory, but didn’t detail what that monitoring looks like. To some extent, it doesn’t matter. The details of the properties they find speak for themselves: The property is either up for sale or it isn’t; the government is either the buyer or it’s not. The tracker can get you started — and it’s up to the reporter to verify.
The main downside is that they might miss properties that are in play. But in that case, reporters are no worse off than before using the site.
On transparency, a few clicks lead to the people behind the tracker. They are listed on Project Salt Box as “a volunteer-based group of public records enthusiasts and independent researchers. Proudly based in Baltimore, MD.” When it comes to institutional affiliation, Project Salt Box is the polar opposite of the Deportation Data Project. The defining word is “independent.” If that gives you pause, it should.
At a basic level, though, identifying properties remains in the local reporter’s hands. The site is just a starting point. Other information on the site falls into a different category. It gives many estimates of the impact and future costs of turning a warehouse into a detention center. The framework is useful, but the estimates need to be treated with caution.
ARRESTS: A growing piece of the enforcement picture is the cooperation of state and local law enforcement agencies. The number of agreements between ICE and these agencies has climbed from 135 when Trump took office to more than 1,700 as of April 2026.
The program goes by its section number in the Immigration and Nationality Act, 287(g), and the biggest change came with the passage of the One Big Beautiful Bill Act. As we’ve noted before, that law allowed ICE, for the first time, to pay state and local agencies that sign on to the fullest type of agreement, the Task Force Model. This arrangement effectively turns local police into federal enforcement agents.
Andrew Thrasher built a page and a map to show where 287(g) agreements are in place.
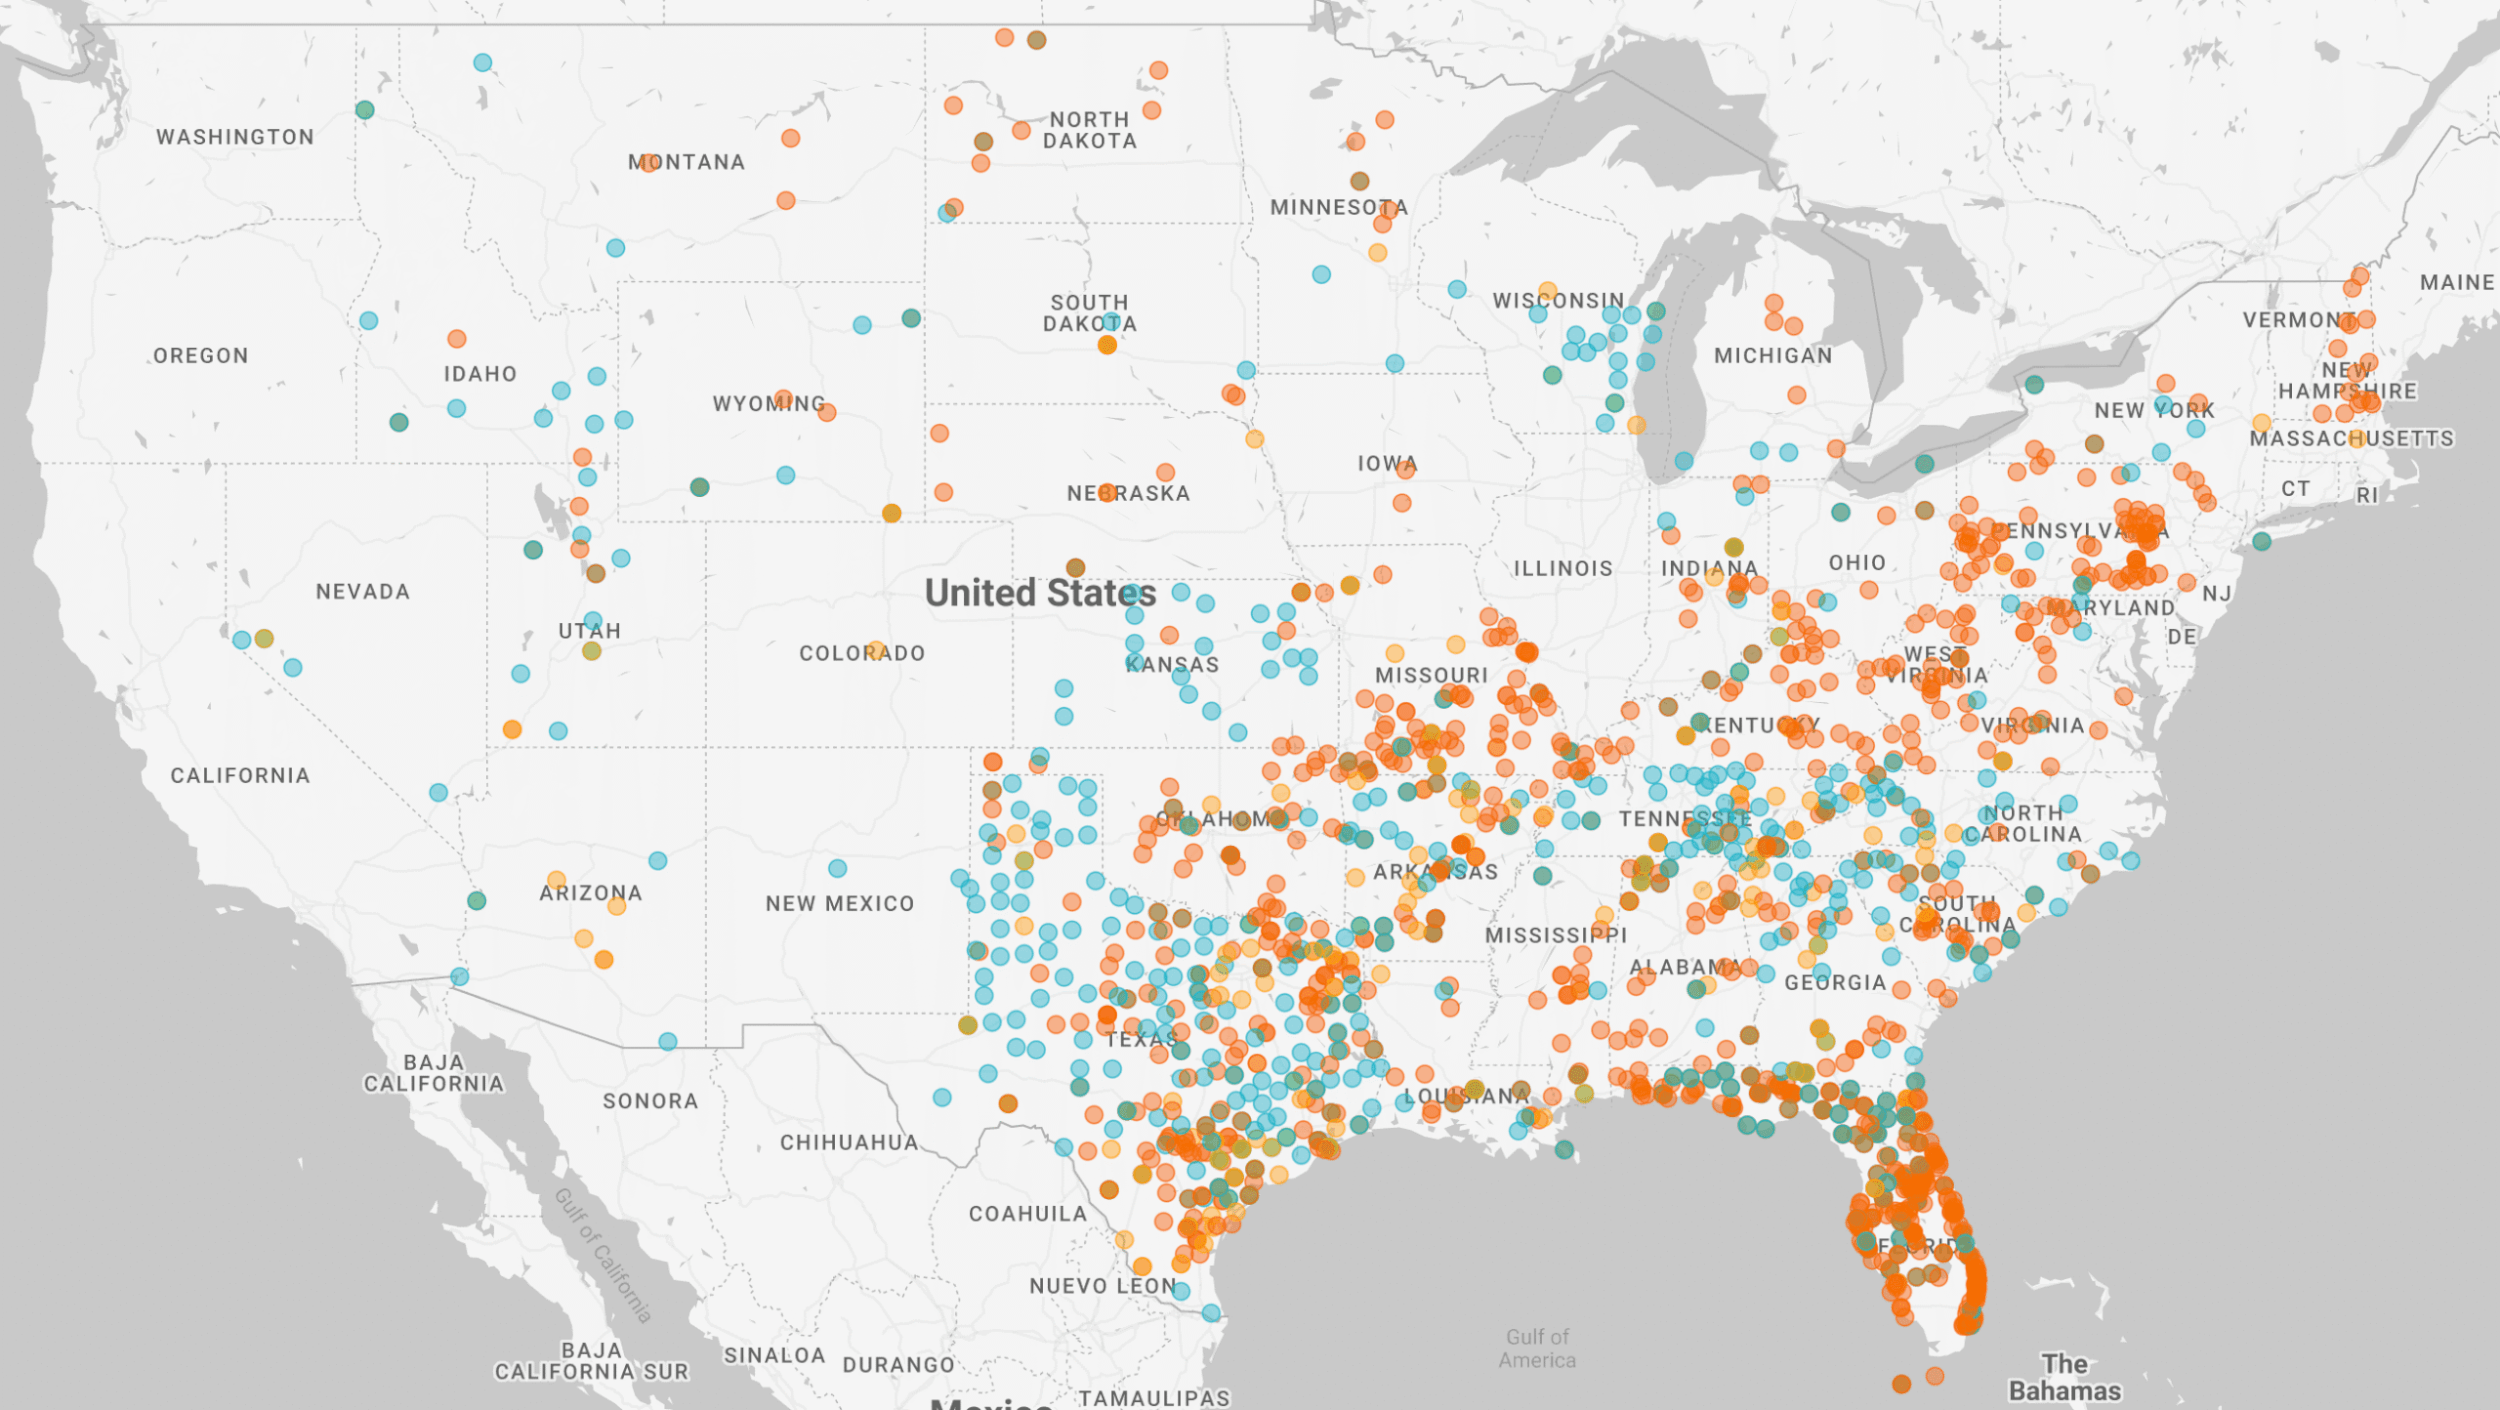
This independent web tool allows users to sort the state and local law enforcement agencies that have signed 287(g) agreements with ICE and to highlight the ones with the highest level of cooperation, the Task Force Model. (Screenshot)
When I first came across Thrasher’s map, it took a bit of work to learn more about him. Not because he is secretive, but because there’s no About page on his site. Following a trail of links leads to his Maxwell Commons Substack page and, embedded in one post, Thrasher asks rhetorically, “But first, who is writing this thing?”
There, he notes that he has spent about a decade as a tech adviser to law firms focused on immigration. He is well-versed in the challenges of working with data, and with the zeal of a jigsaw puzzle fan, he writes about how the ICE 287(g) data is rife with glitches.
Thrasher said he knows the site needs more transparency. It’s still evolving, and he said he is “working on a succinct way of explaining this background” as part of a refresh.
Finding out how much ICE is paying local police is no easy task. Groups filing public records requests are being told by local law enforcement agencies that they can’t share that information under direction from ICE. A ledger of payments leaked to journalist Ken Klippenstein showed significant sums changing hands, like $4.2 million to the Arkansas State Police and over $89 million for Florida’s Department of Highway Safety.
Tips for reporters and web tool builders
The point about these websites is not that they are unreliable, but that journalists can’t assume they are reliable without verification. FOIA expert David Cuillier of the University of Florida puts the onus on reporters to verify what the websites offer.
“We don’t know if they are being honest or not, and when the website is not transparent, that raises a lot of red flags,” Cuillier said.
He said reporters need to know a site’s purpose, funders and methodology.
Kocher said the people behind these tools have their own to-do list.
“One of the consequences of having a lot of new people play in the sandbox is they actually don’t know how to talk about their work,” Kocher said.
That doesn’t mean they can skip the essentials of transparency.
“We have to do it, and we have to sort of remind each other about the importance of the basics along the way,” Kocher said. “That’s what gets lost in these moments where everything’s so volatile. Sometimes we lose sight of the basics.”